AI Agent Tracing
Track agent behavior and evaluate performance in real-time with OpenTelemetry-based tracing.
Tracing provides comprehensive observability for your AI agents, automatically capturing execution traces, spans, and performance metrics. All tracing is built on OpenTelemetry standards, so you can monitor agent behavior regardless of implementation language.

Use your coding agent
Install the Judgment skill so your coding agent can add tracing with Judgment best practices.
Use your coding agent with this instruction so it can install the Judgment skill and apply it to your task.
Install the Judgment skill from github.com/JudgmentLabs/skills
and use it to add tracing to this application
following Judgment best practices.
Add the Judgment skill yourself:
npx skills add JudgmentLabs/skills --skill "judgment"Then give your agent the task:
Add Judgment tracing to this application following best practices.Quickstart
Initialize the Tracer
from judgeval import Tracer

Tracer.init(project_name="default_project")import { Tracer } from "judgeval";
await Tracer.init({
projectName: "default_project",
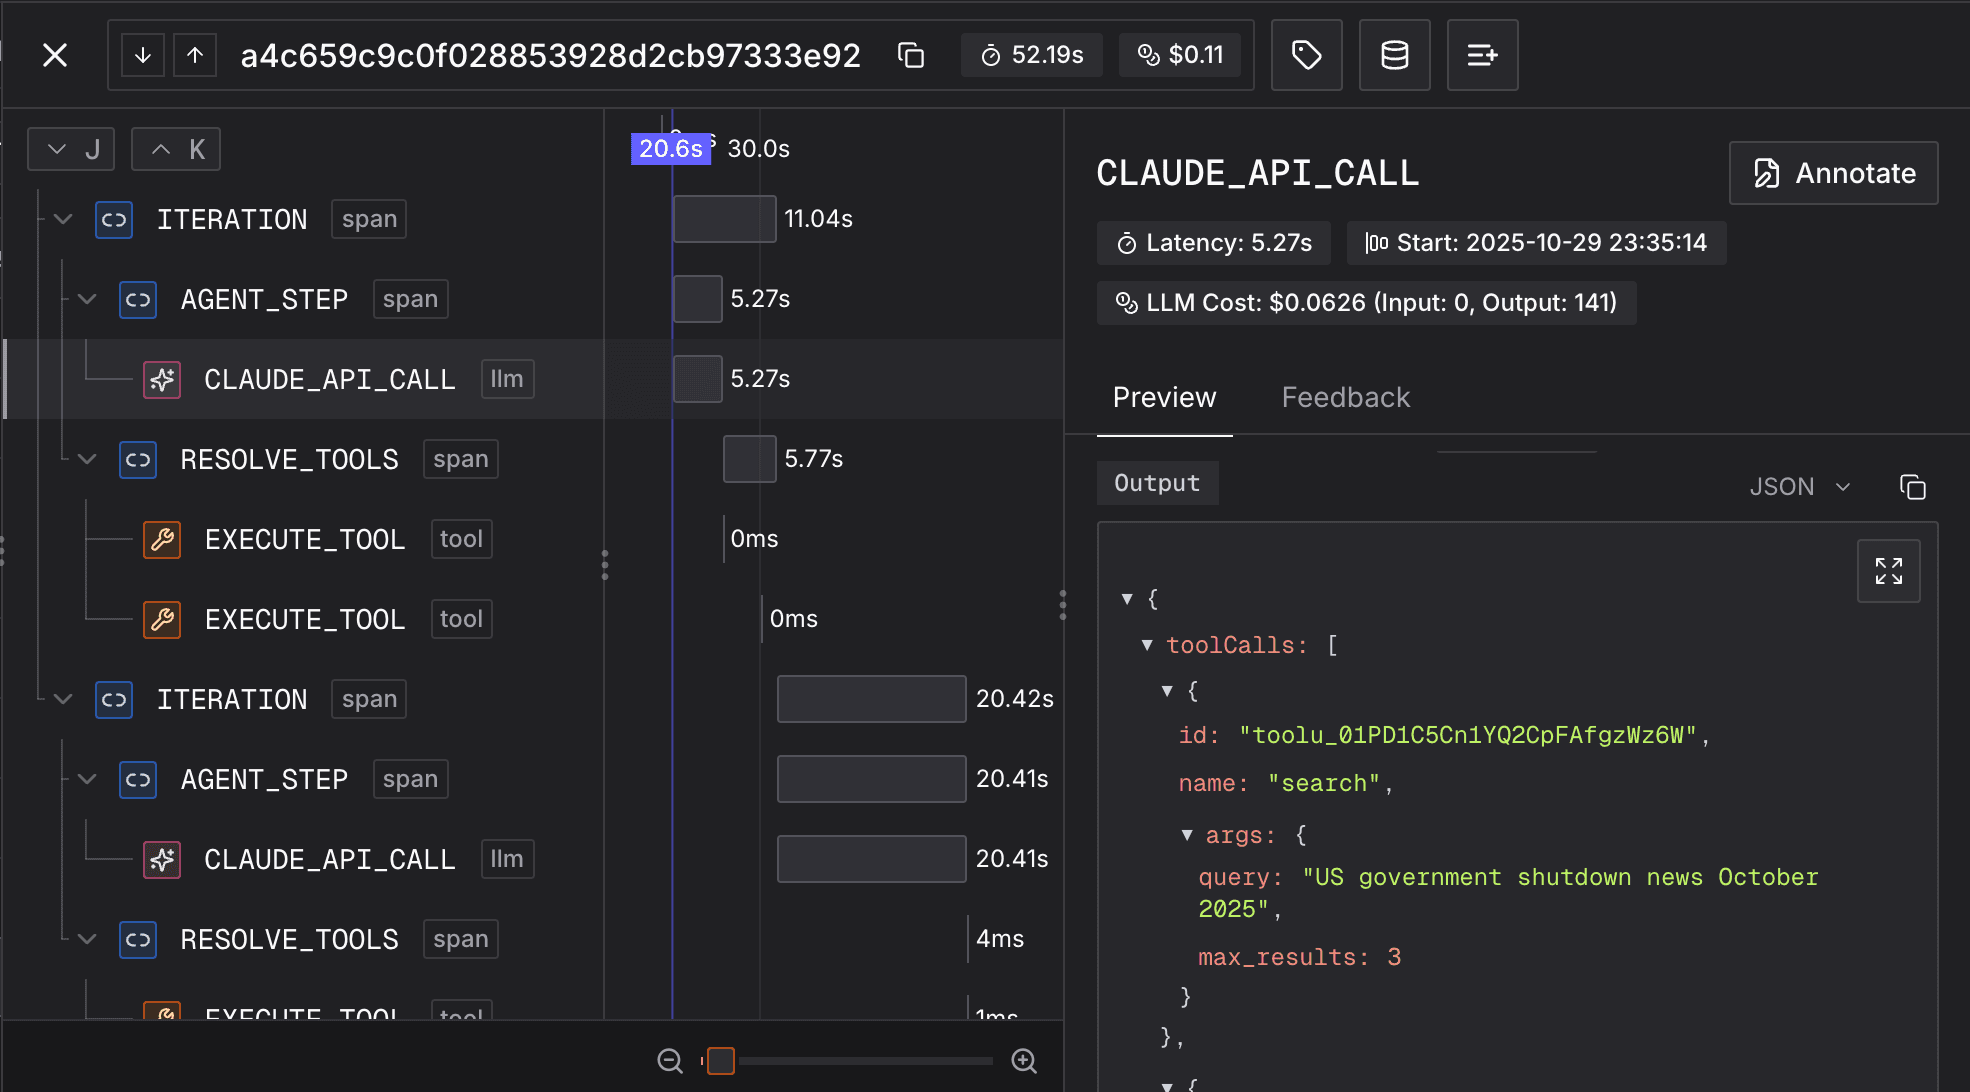
});Trace your Agent
Tracing captures your agent's inputs, outputs, tool calls, and LLM calls to help you debug and analyze agent behavior.
To properly trace your agent, use @Tracer.observe() decorator on all functions and tools of your agent, including LLM calls.
from openai import OpenAI
from judgeval import Tracer
import time
Tracer.init(project_name="default_project")
openai = OpenAI()
@Tracer.observe(span_type="tool")
def format_task(question: str) -> str:
time.sleep(0.5)
return f"Please answer the following question: {question}"
@Tracer.observe(span_type="llm")
def openai_completion(prompt: str) -> str:
response = openai.chat.completions.create(
model="gpt-5.2",
messages=[{"role": "user", "content": prompt}]
)
return response.choices[0].message.content
@Tracer.observe(span_type="tool")
def answer_question(prompt: str) -> str:
time.sleep(0.3)
return openai_completion(prompt)
@Tracer.observe(span_type="function")
def run_agent(question: str) -> str:
task = format_task(question)
answer = answer_question(task)
return answer
if __name__ == "__main__":
result = run_agent("What is the capital of the United States?")
print(result)To properly trace your agent, use Tracer.observe(...) to wrap all functions and tools of your agent, including LLM calls.
import { Tracer } from "judgeval";
import OpenAI from "openai";
const openai = new OpenAI({
apiKey: process.env.OPENAI_API_KEY,
});
await Tracer.init({
projectName: "default_project",
});
const runAgent = Tracer.observe(async function runAgent(
question: string
): Promise<string> {
const task = await formatTask(question);
const answer = await answerQuestion(task);
return answer;
},
"function");
const formatTask = Tracer.observe(async function formatTask(
question: string
): Promise<string> {
await new Promise((resolve) => setTimeout(resolve, 500));
return `Please answer the following question: ${question}`;
},
"tool");
const answerQuestion = Tracer.observe(async function answerQuestion(
prompt: string
): Promise<string> {
await new Promise((resolve) => setTimeout(resolve, 300));
return await openAICompletion(prompt);
},
"tool");
const openAICompletion = Tracer.observe(async function openAICompletion(
prompt: string
): Promise<string> {
const response = await openai.chat.completions.create({
model: "gpt-5.2",
messages: [{ role: "user", content: prompt }],
});
return response.choices[0]?.message.content || "No answer";
},
"llm");
await runAgent("What is the capital of the United States?");
await Tracer.shutdown();Congratulations! You've just created your first trace. It should look like this:


Trace Across Multiple Files
Real agents usually split orchestration, tools, and model calls across modules. Initialize Tracer once in your application entrypoint, then observe functions in each file where work happens. When an observed function calls another observed function, Judgment keeps the spans connected in one trace tree even if those functions live in different files.
from judgeval import Tracer
Tracer.init(project_name="default_project")
from agent import run_agent
if __name__ == "__main__":
result = run_agent("Which customers are at risk this week?")
print(result)from judgeval import Tracer
from tools import build_search_query, retrieve_context, draft_answer
@Tracer.observe(span_type="function")
def run_agent(question: str) -> str:
query = build_search_query(question)
context = retrieve_context(query)
return draft_answer(question, context)from openai import OpenAI
from judgeval import Tracer
openai = OpenAI()
@Tracer.observe(span_type="tool")
def build_search_query(question: str) -> str:
return f"customer health risk signals for: {question}"
@Tracer.observe(span_type="tool")
def retrieve_context(query: str) -> str:
return f"Relevant CRM notes and usage metrics for '{query}'"
@Tracer.observe(span_type="llm")
def draft_answer(question: str, context: str) -> str:
response = openai.chat.completions.create(
model="gpt-5.2",
messages=[
{"role": "system", "content": "Answer using the provided context."},
{"role": "user", "content": f"Question: {question}\n\nContext: {context}"},
],
)
return response.choices[0].message.contentimport { Tracer } from "judgeval";
await Tracer.init({
projectName: "default_project",
});
const { runAgent } = await import("./agent");
const result = await runAgent("Which customers are at risk this week?");
console.log(result);
await Tracer.shutdown();import { Tracer } from "judgeval";
import { buildSearchQuery, retrieveContext, draftAnswer } from "./tools";
export const runAgent = Tracer.observe(async function runAgent(
question: string
): Promise<string> {
const query = await buildSearchQuery(question);
const context = await retrieveContext(query);
return await draftAnswer(question, context);
},
"function");import { Tracer } from "judgeval";
import OpenAI from "openai";
const openai = new OpenAI({
apiKey: process.env.OPENAI_API_KEY,
});
export const buildSearchQuery = Tracer.observe(async function buildSearchQuery(
question: string
): Promise<string> {
return `customer health risk signals for: ${question}`;
},
"tool");
export const retrieveContext = Tracer.observe(async function retrieveContext(
query: string
): Promise<string> {
return `Relevant CRM notes and usage metrics for '${query}'`;
},
"tool");
export const draftAnswer = Tracer.observe(async function draftAnswer(
question: string,
context: string
): Promise<string> {
const response = await openai.chat.completions.create({
model: "gpt-5.2",
messages: [
{ role: "system", content: "Answer using the provided context." },
{ role: "user", content: `Question: ${question}\n\nContext: ${context}` },
],
});
return response.choices[0]?.message.content || "No answer";
},
"llm");Grouping Traces into Sessions
Sessions allow you to group related traces together, providing a conversation-level view of user interactions with your agent. By associating traces with a session ID, you can analyze entire conversations, track behavior patterns across multiple requests, and understand how your agent performs over extended interactions.
Setting Session IDs
Use set_session_id() to associate traces with a session. All child spans within that trace will automatically inherit the session ID.
from judgeval import Tracer, wrap
from openai import OpenAI
import uuid
Tracer.init(project_name="default_project")
openai = wrap(OpenAI())
session_id = str(uuid.uuid4())
@Tracer.observe(span_type="function")
def chat_turn(user_message: str) -> str:
Tracer.set_session_id(session_id)
response = openai.chat.completions.create(
model="gpt-5.2",
messages=[{"role": "user", "content": user_message}]
)
return response.choices[0].message.content
if __name__ == "__main__":
print(chat_turn("Hello! What's the weather like?"))
print(chat_turn("Can you recommend a restaurant nearby?"))
print(chat_turn("Thanks for your help!"))import { Tracer } from "judgeval";
import OpenAI from "openai";
import { randomUUID } from "crypto";
await Tracer.init({
projectName: "default_project",
});
const openai = new OpenAI({
apiKey: process.env.OPENAI_API_KEY,
});
// Generate a unique session ID for this conversation
const sessionId = randomUUID();
const chatTurn = Tracer.observe(async function chatTurn(
userMessage: string
): Promise<string> {
Tracer.setSessionId(sessionId); // Associate this trace with the session
const response = await openai.chat.completions.create({
model: "gpt-5.2",
messages: [{ role: "user", content: userMessage }],
});
return response.choices[0]?.message.content || "No response";
}, "function");
// Multiple traces, all associated with the same session
await chatTurn("Hello! What's the weather like?");
await chatTurn("Can you recommend a restaurant nearby?");
await chatTurn("Thanks for your help!");
await Tracer.shutdown();What Sessions Capture
Sessions aggregate data from all associated traces to provide comprehensive insights:
| Metric | Description |
|---|---|
| Session ID | The unique identifier for the session |
| Created At | The earliest trace start time in the session |
| Duration | Time between the earliest trace start time and the latest trace end time in the session |
| LLM Cost | Total LLM cost summed across all traces in the session |
| Trace Count | Number of traces associated with the session |
| Behaviors | Aggregated behaviors — if any trace in the session exhibits a behavior, the entire session is marked with that behavior |
Viewing Sessions
Navigate to the Sessions tab in Monitoring to view all sessions:
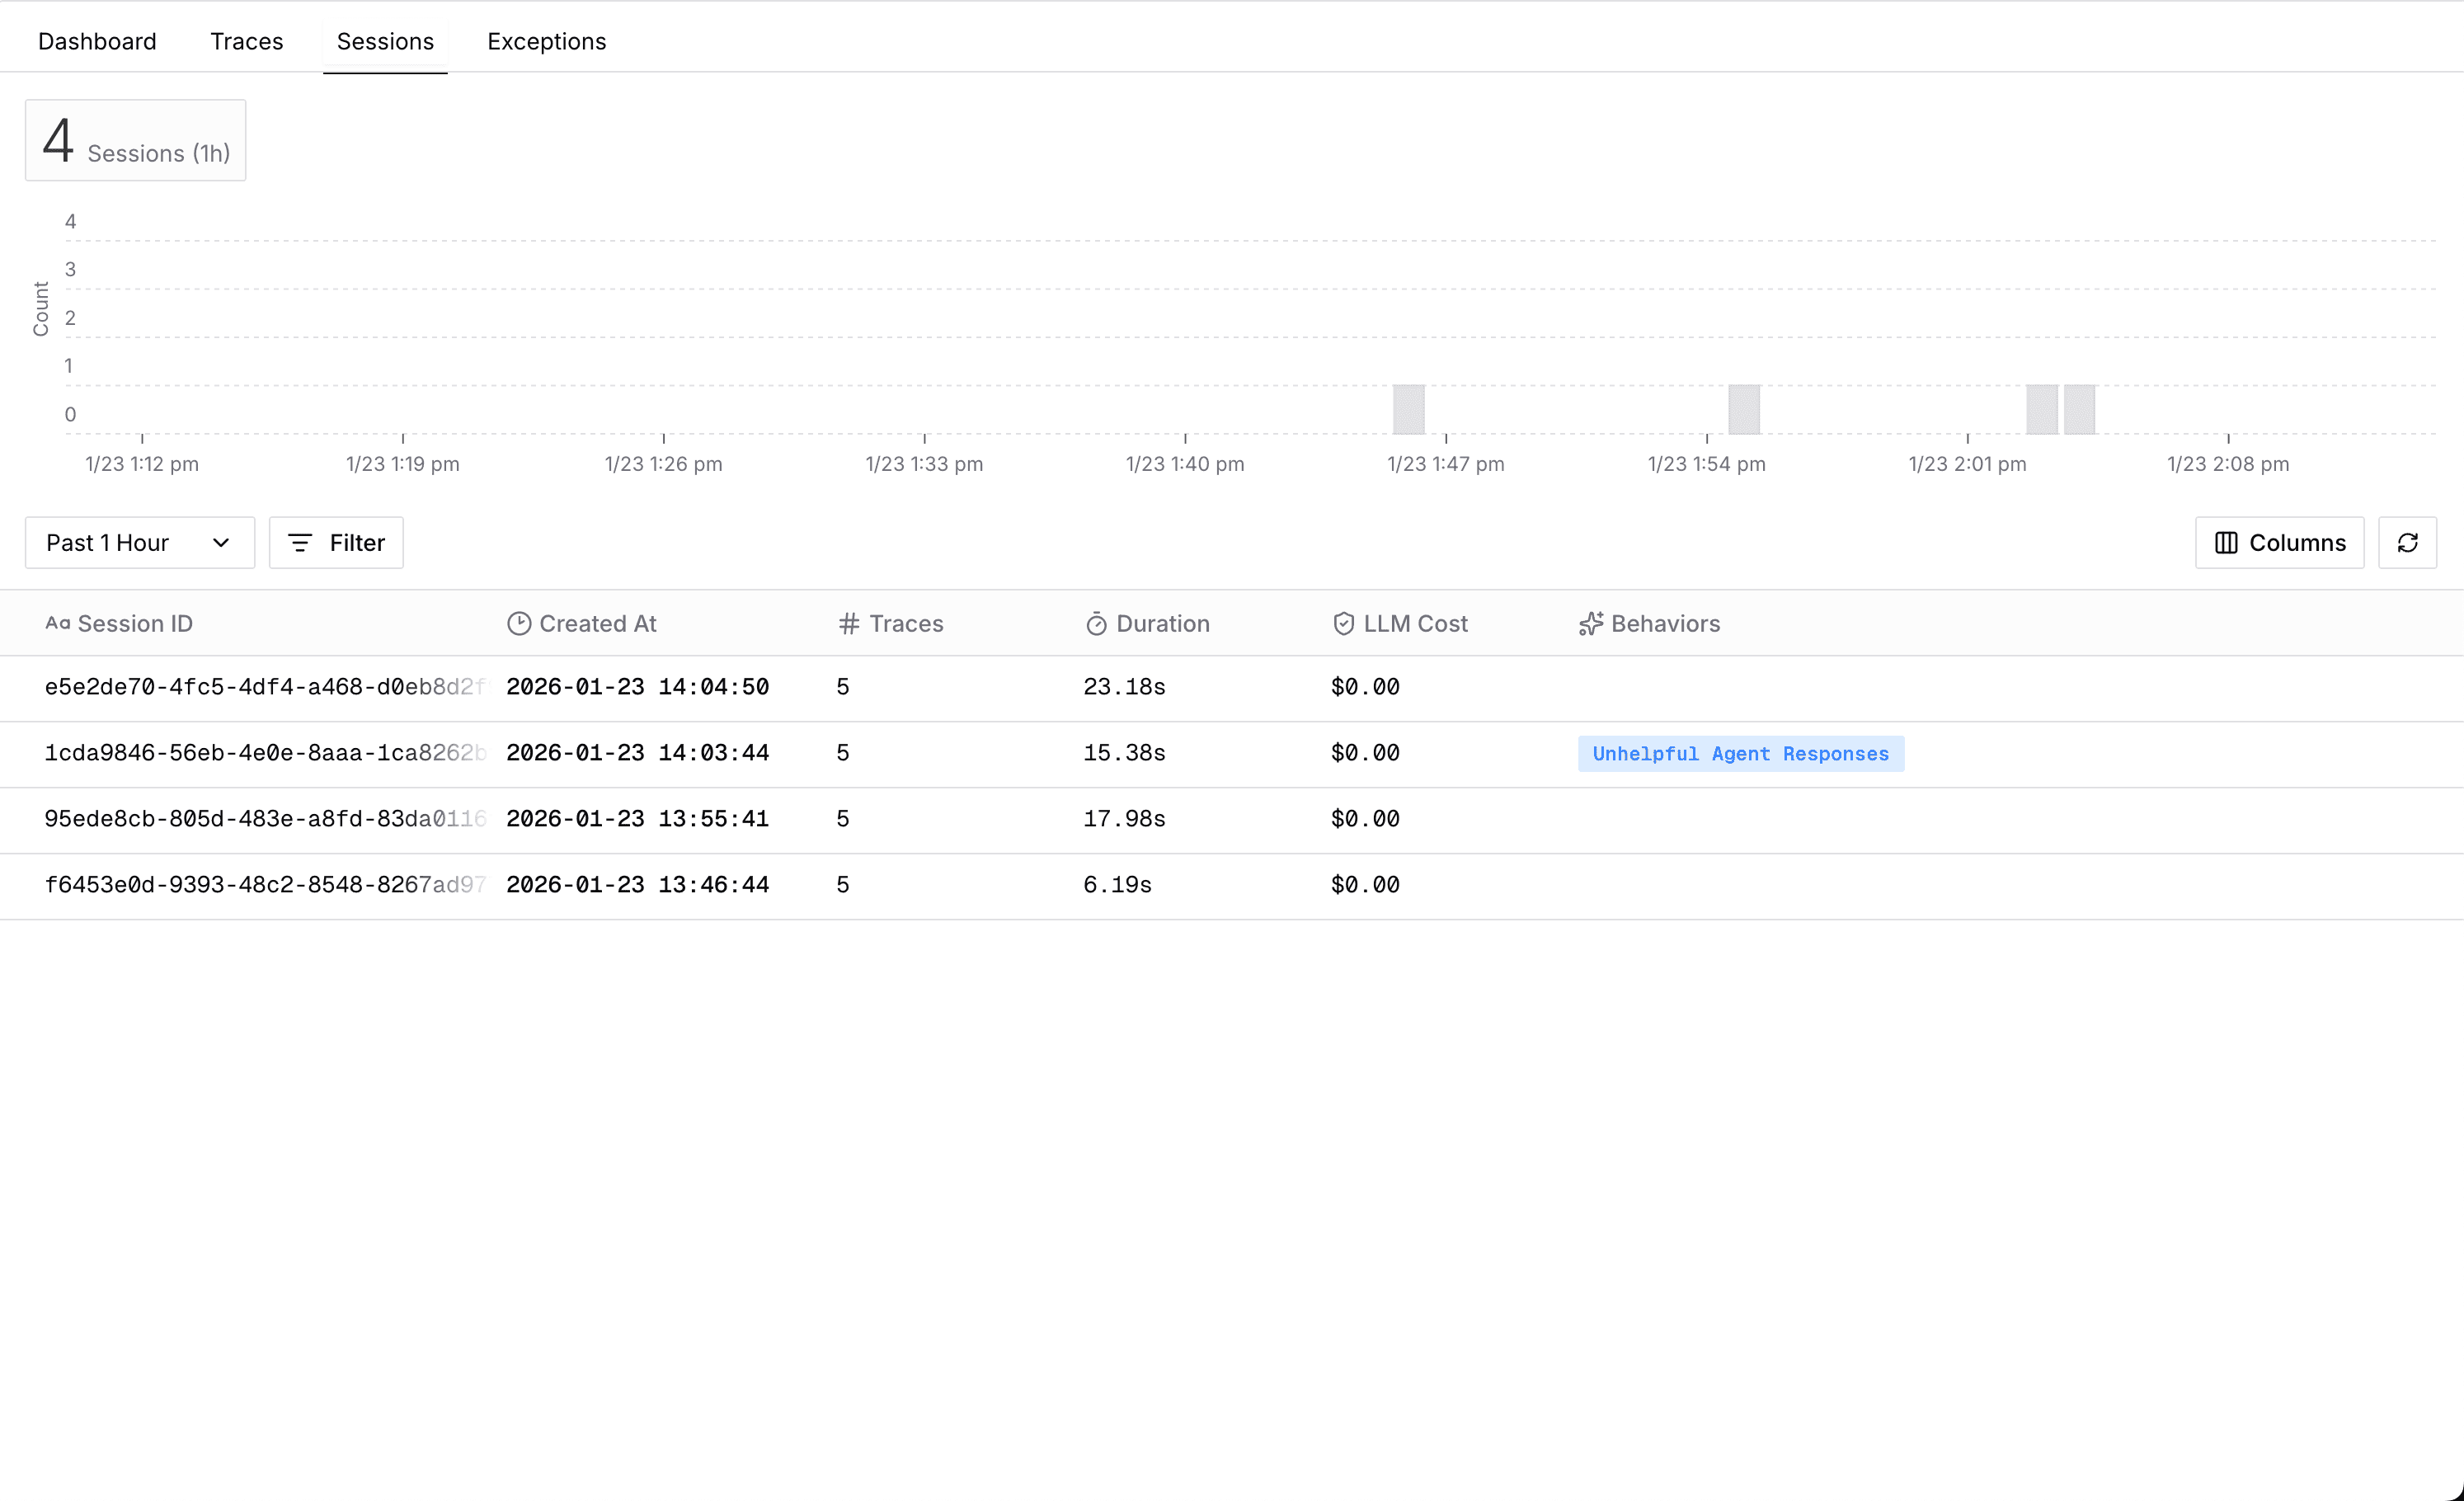

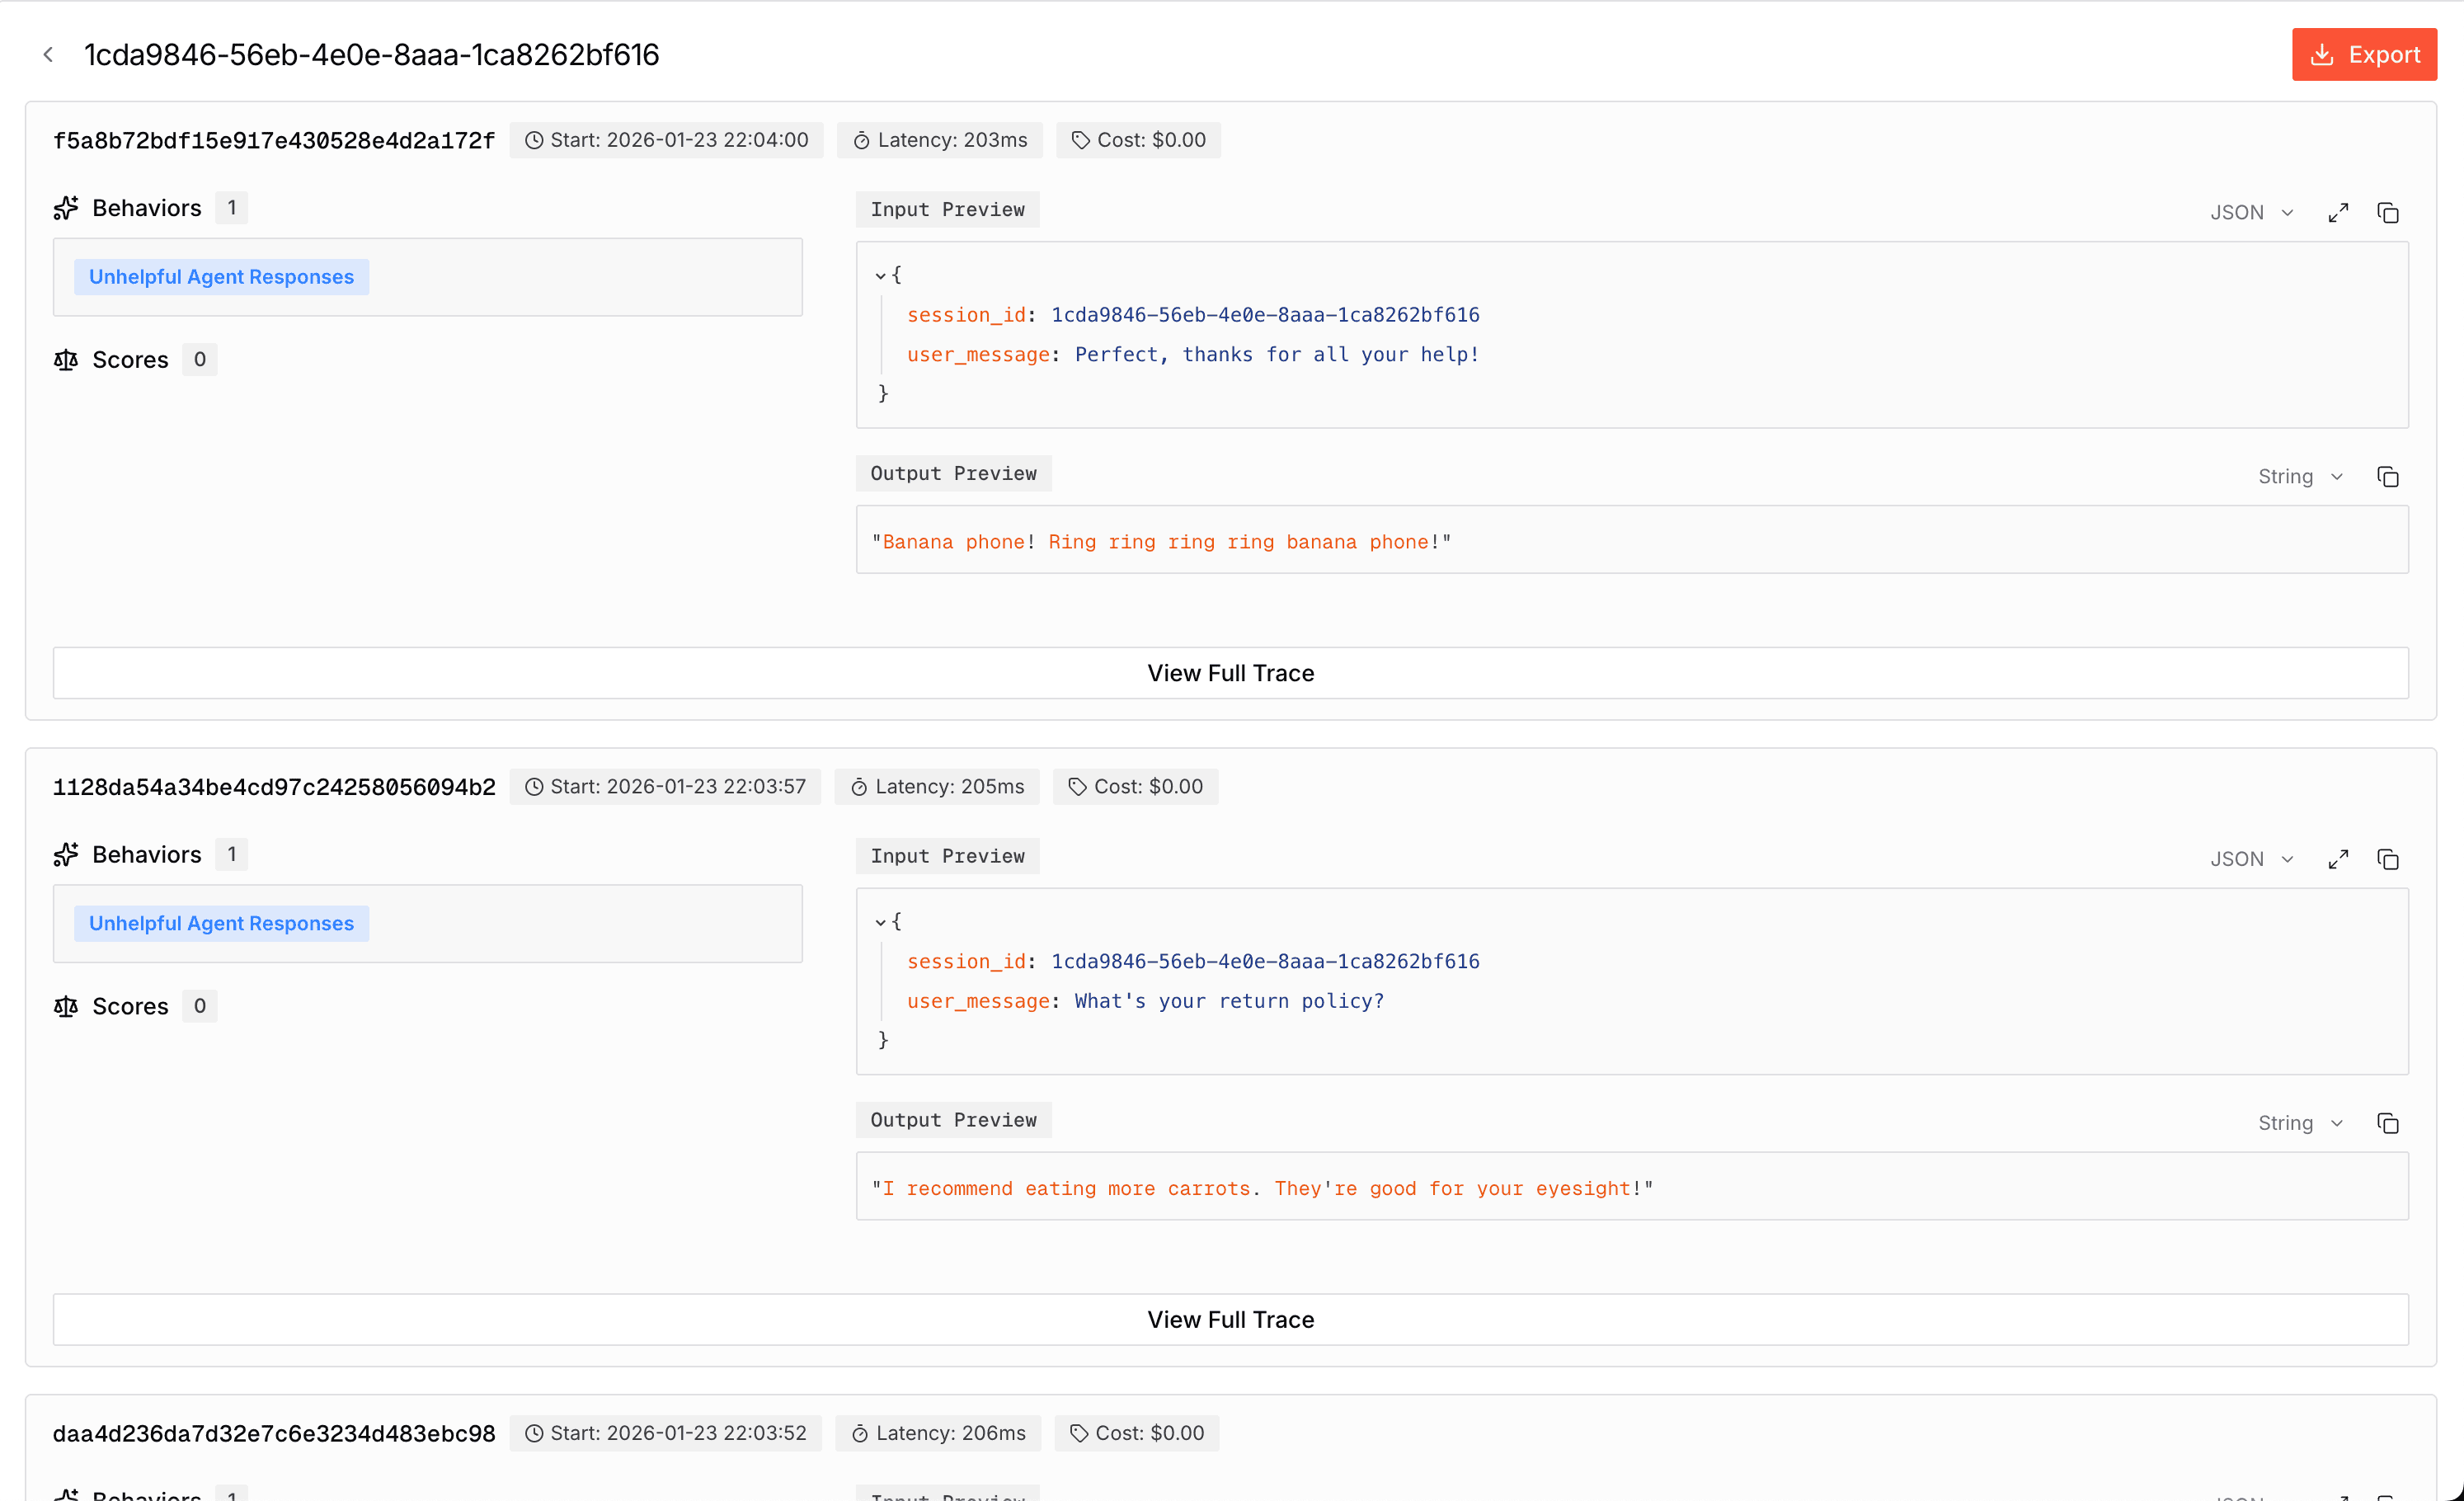
Click on any session to see all traces within that session:

Project Routing
Multi-Project Support allows you to route traces to different projects at runtime. Initialize multiple tracers for different projects, then use set_active() in Python or setActive() in TypeScript to switch which project receives traces.
import os
from judgeval import Tracer, wrap
from openai import OpenAI
env = os.getenv("ENVIRONMENT", "staging") # "staging" or "production"
tracer_staging = Tracer.init(project_name="staging - my_agent", set_active=(env == "staging"))
tracer_prod = Tracer.init(project_name="production - my_agent", set_active=(env == "production"))
openai = wrap(OpenAI())
@Tracer.observe(span_type="function")
def handle_request(query: str) -> str:
response = openai.chat.completions.create(
model="gpt-4o-mini",
messages=[{"role": "user", "content": query}]
)
return response.choices[0].message.content
if __name__ == "__main__":
print(handle_request("What is the capital of France?"))import { Tracer } from "judgeval";
import OpenAI from "openai";
const env = process.env.ENVIRONMENT ?? "staging"; // "staging" or "production"
const tracerStaging = await Tracer.init({
projectName: "staging - my_agent",
setActive: env === "staging",
});
const tracerProd = await Tracer.init({
projectName: "production - my_agent",
setActive: env === "production",
});
const openai = new OpenAI({
apiKey: process.env.OPENAI_API_KEY,
});
// You can switch manually before starting a new root span.
if (env === "production") {
tracerProd.setActive();
} else {
tracerStaging.setActive();
}
const handleRequest = Tracer.observe(async function handleRequest(
query: string
): Promise<string> {
const response = await openai.chat.completions.create({
model: "gpt-4o-mini",
messages: [{ role: "user", content: query }],
});
return response.choices[0]?.message.content || "No answer";
},
"function");
console.log(await handleRequest("What is the capital of France?"));
await Tracer.shutdown();Manual Attribute Setting
You can manually set attributes on spans to add custom metadata or explicitly capture input/output data. This is useful when you want to add additional context that isn't automatically captured.
Setting Input and Output
Use Tracer.set_input() / Tracer.set_output() in Python or Tracer.setInput() / Tracer.setOutput() in TypeScript to explicitly set input and output data on the current span:
from judgeval import Tracer
from openai import OpenAI
Tracer.init(project_name="default_project")
openai = OpenAI()
@Tracer.observe(span_type="function")
def process_query(user_query: str) -> str:
Tracer.set_input(user_query)
response = openai.chat.completions.create(
model="gpt-5.2",
messages=[{"role": "user", "content": user_query}]
)
result = response.choices[0].message.content
Tracer.set_output(result)
return result
result = process_query("What is the capital of France?")
print(result)import { Tracer } from "judgeval";
import OpenAI from "openai";
await Tracer.init({
projectName: "default_project",
});
const openai = new OpenAI({
apiKey: process.env.OPENAI_API_KEY,
});
const processQuery = Tracer.observe(async function processQuery(
userQuery: string
): Promise<string> {
Tracer.setInput(userQuery);
const response = await openai.chat.completions.create({
model: "gpt-5.2",
messages: [{ role: "user", content: userQuery }],
});
const result = response.choices[0]?.message.content || "No answer";
Tracer.setOutput(result);
return result;
},
"function");
const result = await processQuery("What is the capital of France?");
console.log(result);
await Tracer.shutdown();Setting Custom Attributes
Use Tracer.set_attribute() in Python or Tracer.setAttribute() in TypeScript to add custom metadata to spans:
from judgeval import Tracer
from openai import OpenAI
Tracer.init(project_name="default_project")
openai = OpenAI()
@Tracer.observe(span_type="function")
def analyze_sentiment(text: str, user_id: str) -> str:
Tracer.set_attribute("user_id", user_id)
Tracer.set_attribute("text_length", len(text))
Tracer.set_attribute("analysis_type", "sentiment")
response = openai.chat.completions.create(
model="gpt-5.2",
messages=[
{"role": "system", "content": "Analyze the sentiment of the text."},
{"role": "user", "content": text}
]
)
result = response.choices[0].message.content
Tracer.set_output(result)
return result
result = analyze_sentiment("I love this product!", "user_123")
print(result)import { Tracer } from "judgeval";
import OpenAI from "openai";
await Tracer.init({
projectName: "default_project",
});
const openai = new OpenAI({
apiKey: process.env.OPENAI_API_KEY,
});
const analyzeSentiment = Tracer.observe(async function analyzeSentiment(
text: string,
userId: string
): Promise<string> {
Tracer.setAttribute("user_id", userId);
Tracer.setAttribute("text_length", text.length);
Tracer.setAttribute("analysis_type", "sentiment");
const response = await openai.chat.completions.create({
model: "gpt-5.2",
messages: [
{ role: "system", content: "Analyze the sentiment of the text." },
{ role: "user", content: text },
],
});
const result = response.choices[0]?.message.content || "No answer";
Tracer.setOutput(result);
return result;
},
"function");
const result = await analyzeSentiment("I love this product!", "user_123");
console.log(result);
await Tracer.shutdown();Setting Multiple Attributes
Use Tracer.set_attributes() in Python or Tracer.setAttributes() in TypeScript to set multiple attributes at once:
from judgeval import Tracer
Tracer.init(project_name="default_project")
@Tracer.observe(span_type="function")
def process_order(order_id: str, customer_id: str, total: float):
Tracer.set_attributes({
"order_id": order_id,
"customer_id": customer_id,
"order_total": total,
"currency": "USD",
"payment_method": "credit_card"
})
return {"status": "processed", "order_id": order_id}
result = process_order("order_123", "customer_456", 99.99)import { Tracer } from "judgeval";
await Tracer.init({
projectName: "default_project",
});
const processOrder = Tracer.observe(async function processOrder(
orderId: string,
customerId: string,
total: number
): Promise<{ status: string; orderId: string }> {
Tracer.setAttributes({
order_id: orderId,
customer_id: customerId,
order_total: total,
currency: "USD",
payment_method: "credit_card",
});
return { status: "processed", orderId };
},
"function");
const result = await processOrder("order_123", "customer_456", 99.99);
console.log(result);
await Tracer.shutdown();Setting Propagating Attributes
Use Tracer.set_propagating_attribute() in Python or Tracer.setPropagatingAttribute() in TypeScript to set an attribute that propagates to all child spans, not just the current one. This is useful for tagging every span in a request with shared context (e.g. a surface or tenant identifier).
from judgeval import Tracer
Tracer.init(project_name="default_project")
@Tracer.observe(span_type="function")
def handle_request(surface: str):
# Applies to this span and every child span
Tracer.set_propagating_attribute("app.surface", surface)
return process()
result = handle_request("slack")import { Tracer } from "judgeval";
await Tracer.init({
projectName: "default_project",
});
const handleRequest = Tracer.observe(async function handleRequest(
surface: string
): Promise<string> {
// Applies to this span and every child span
Tracer.setPropagatingAttribute("app.surface", surface);
return process();
},
"function");
const result = await handleRequest("slack");
console.log(result);
await Tracer.shutdown();Auto-Instrumentation
Auto-instrumentation automatically traces LLM client calls without manually wrapping each call with observe(). This reduces boilerplate code and ensures all LLM interactions are captured.
Python supports auto-instrumentation through the wrap() function. It automatically tracks all LLM API calls including token usage, costs, and streaming responses for both sync and async clients.
Refer to Model Providers for more information on supported providers.
from judgeval import Tracer, wrap
from openai import OpenAI
Tracer.init(project_name="default_project")
openai = wrap(OpenAI())
@Tracer.observe(span_type="function")
def ask_question(question: str) -> str:
response = openai.chat.completions.create(
model="gpt-5.2",
messages=[{"role": "user", "content": question}]
)
return response.choices[0].message.content
result = ask_question("What is the capital of France?")
print(result)To correctly implement auto-instrumentation on LLM calls, you need to do all of the following:
- Initialize an instrumentation file to be preloaded before the application starts.
- Register OpenTelemetry instrumentations on
Tracerbefore callingTracer.init(). - Bundle your application using CommonJS.
import { OpenAIInstrumentation } from "@opentelemetry/instrumentation-openai";
import { Tracer } from "judgeval";
Tracer.registerOTELInstrumentation(new OpenAIInstrumentation());
await Tracer.init({
projectName: "auto_instrumentation_example",
});import "./instrumentation";
import { Tracer } from "judgeval";
import OpenAI from "openai";
function requireEnv(name: string): string {
const value = process.env[name];
if (!value) {
throw new Error(`Environment variable ${name} is not set`);
}
return value;
}
const OPENAI_API_KEY = requireEnv("OPENAI_API_KEY");
const openai = new OpenAI({
apiKey: OPENAI_API_KEY,
});
async function _chatWithUser(userMessage: string): Promise<string> {
const messages: OpenAI.Chat.ChatCompletionMessageParam[] = [
{ role: "system", content: "You are a helpful assistant." },
{ role: "user", content: userMessage },
];
const completion = await openai.chat.completions.create({
model: "gpt-5.2",
messages,
});
const result = completion.choices[0].message.content || "";
console.log(`User: ${userMessage}`);
console.log(`Assistant: ${result}`);
Tracer.asyncEvaluate("answer_relevancy", {
input: "What is the capital of France?",
actual_output: result,
});
return result;
}
(async () => {
const chatWithUser = Tracer.observe(_chatWithUser);
const result = await chatWithUser("What is the capital of France?");
console.log(result);
await new Promise((resolve) => setTimeout(resolve, 10000));
await Tracer.shutdown();
})();OpenTelemetry Integration
Judgment's tracing is built on OpenTelemetry, the industry-standard observability framework. This means:
Standards Compliance
- Compatible with existing OpenTelemetry tooling
- Follows OTEL semantic conventions
- Integrates with OTEL collectors and exporters
Advanced Configuration
You can integrate Judgment's tracer with your existing OpenTelemetry setup:
from judgeval import Tracer
from opentelemetry.sdk.trace import TracerProvider
tracer_provider = TracerProvider()
tracer = Tracer.init(project_name="default_project")
tracer_provider.add_span_processor(tracer.get_span_processor())
otel_tracer = tracer_provider.get_tracer(__name__)
def answer_question(question: str) -> str:
return f"Answer for: {question}"
def process_request(question: str) -> str:
with otel_tracer.start_as_current_span("process_request_span") as span:
span.set_attribute("input", question)
answer = answer_question(question)
span.set_attribute("output", answer)
return answerimport { Tracer } from "judgeval";
await Tracer.init({
projectName: "default_project",
});
const otelTracer = Tracer.getOTELTracer();
async function answerQuestion(question: string): Promise<string> {
return `Answer for: ${question}`;
}
async function processRequest(question: string): Promise<string> {
return await otelTracer.startActiveSpan("process_request_span", async (span) => {
try {
span.setAttribute("input", question);
const answer = await answerQuestion(question);
span.setAttribute("output", answer);
return answer;
} finally {
span.end();
}
});
}
console.log(await processRequest("What is the capital of France?"));
await Tracer.shutdown();Resource Attributes
Resource attributes describe the entity producing telemetry data. Common attributes include:
service.name- Name of your serviceservice.version- Version numberdeployment.environment- Environment (production, staging, etc.)service.namespace- Logical grouping
See the OpenTelemetry Resource specification for standard attributes.
Distributed Tracing
Distributed tracing allows you to track requests across multiple services and systems, providing end-to-end visibility into complex workflows. This is essential for understanding how your AI agents interact with external services and how data flows through your distributed architecture.
Sending Trace State
When your agent needs to propagate trace context to downstream services, you can manually extract and send trace context.
uv add judgeval requestspip install judgeval requestsfrom judgeval import Tracer, propagation
import requests
Tracer.init(
project_name="distributed-system",
resource_attributes={"service.name": "agent-client"},
)
@Tracer.observe(span_type="function")
def call_external_service(data):
headers = {
"Content-Type": "application/json",
"Authorization": "Bearer ...",
}
propagation.inject(headers)
response = requests.post(
"http://localhost:8001/process",
json=data,
headers=headers
)
return response.json()
if __name__ == "__main__":
result = call_external_service({"query": "Hello from client"})
print(result)npm install judgeval @opentelemetry/apiyarn add judgeval @opentelemetry/apipnpm add judgeval @opentelemetry/apibun add judgeval @opentelemetry/apiimport { Tracer, propagation } from "judgeval";
await Tracer.init({
projectName: "distributed-system",
resourceAttributes: { "service.name": "agent-client" },
});
async function makeRequest(url: string, options: RequestInit = {}): Promise<any> {
const headers: Record<string, string> = {};
propagation.inject(headers);
const response = await fetch(url, {
...options,
headers: { "Content-Type": "application/json", ...headers },
});
if (!response.ok) {
throw new Error(`HTTP error! status: ${response.status}`);
}
return response.json();
}
const callExternalService = Tracer.observe(async function (data: any) {
return await makeRequest("http://localhost:8001/process", {
method: "POST",
body: JSON.stringify(data),
});
}, "span");
const result = await callExternalService({ message: "Hello!" });
console.log(result);
await Tracer.shutdown();Receiving Trace State
When your service receives requests from other services, you can use middleware to automatically extract and set the trace context for all incoming requests.
uv add judgeval fastapi uvicornpip install judgeval fastapi uvicornfrom judgeval import Tracer
from fastapi import FastAPI, Request
Tracer.init(
project_name="distributed-system",
resource_attributes={"service.name": "agent-server"},
)
app = FastAPI()
@Tracer.observe(span_type="function")
def process_request(data):
return {"message": "Hello from Python server!", "received_data": data}
@app.post("/process")
async def handle_process(request: Request):
with Tracer.continue_trace(request.headers):
result = process_request(await request.json())
return result
if __name__ == "__main__":
import uvicorn
uvicorn.run(app, host="0.0.0.0", port=8001)npm install judgeval @opentelemetry/api expressyarn add judgeval @opentelemetry/api expresspnpm add judgeval @opentelemetry/api expressbun add judgeval @opentelemetry/api expressimport express from "express";
import { Tracer } from "judgeval";
await Tracer.init({
projectName: "distributed-system",
resourceAttributes: { "service.name": "agent-server" },
});
const app = express();
app.use(express.json());
const processRequest = Tracer.observe(async function (data: any) {
return { message: "Hello from server!", received_data: data };
}, "span");
app.post("/process", async (req, res) => {
await Tracer.continueTrace(req.headers, async () => {
const result = await processRequest(req.body);
res.json(result);
});
});
app.listen(8001, () => console.log("Server running on port 8001"));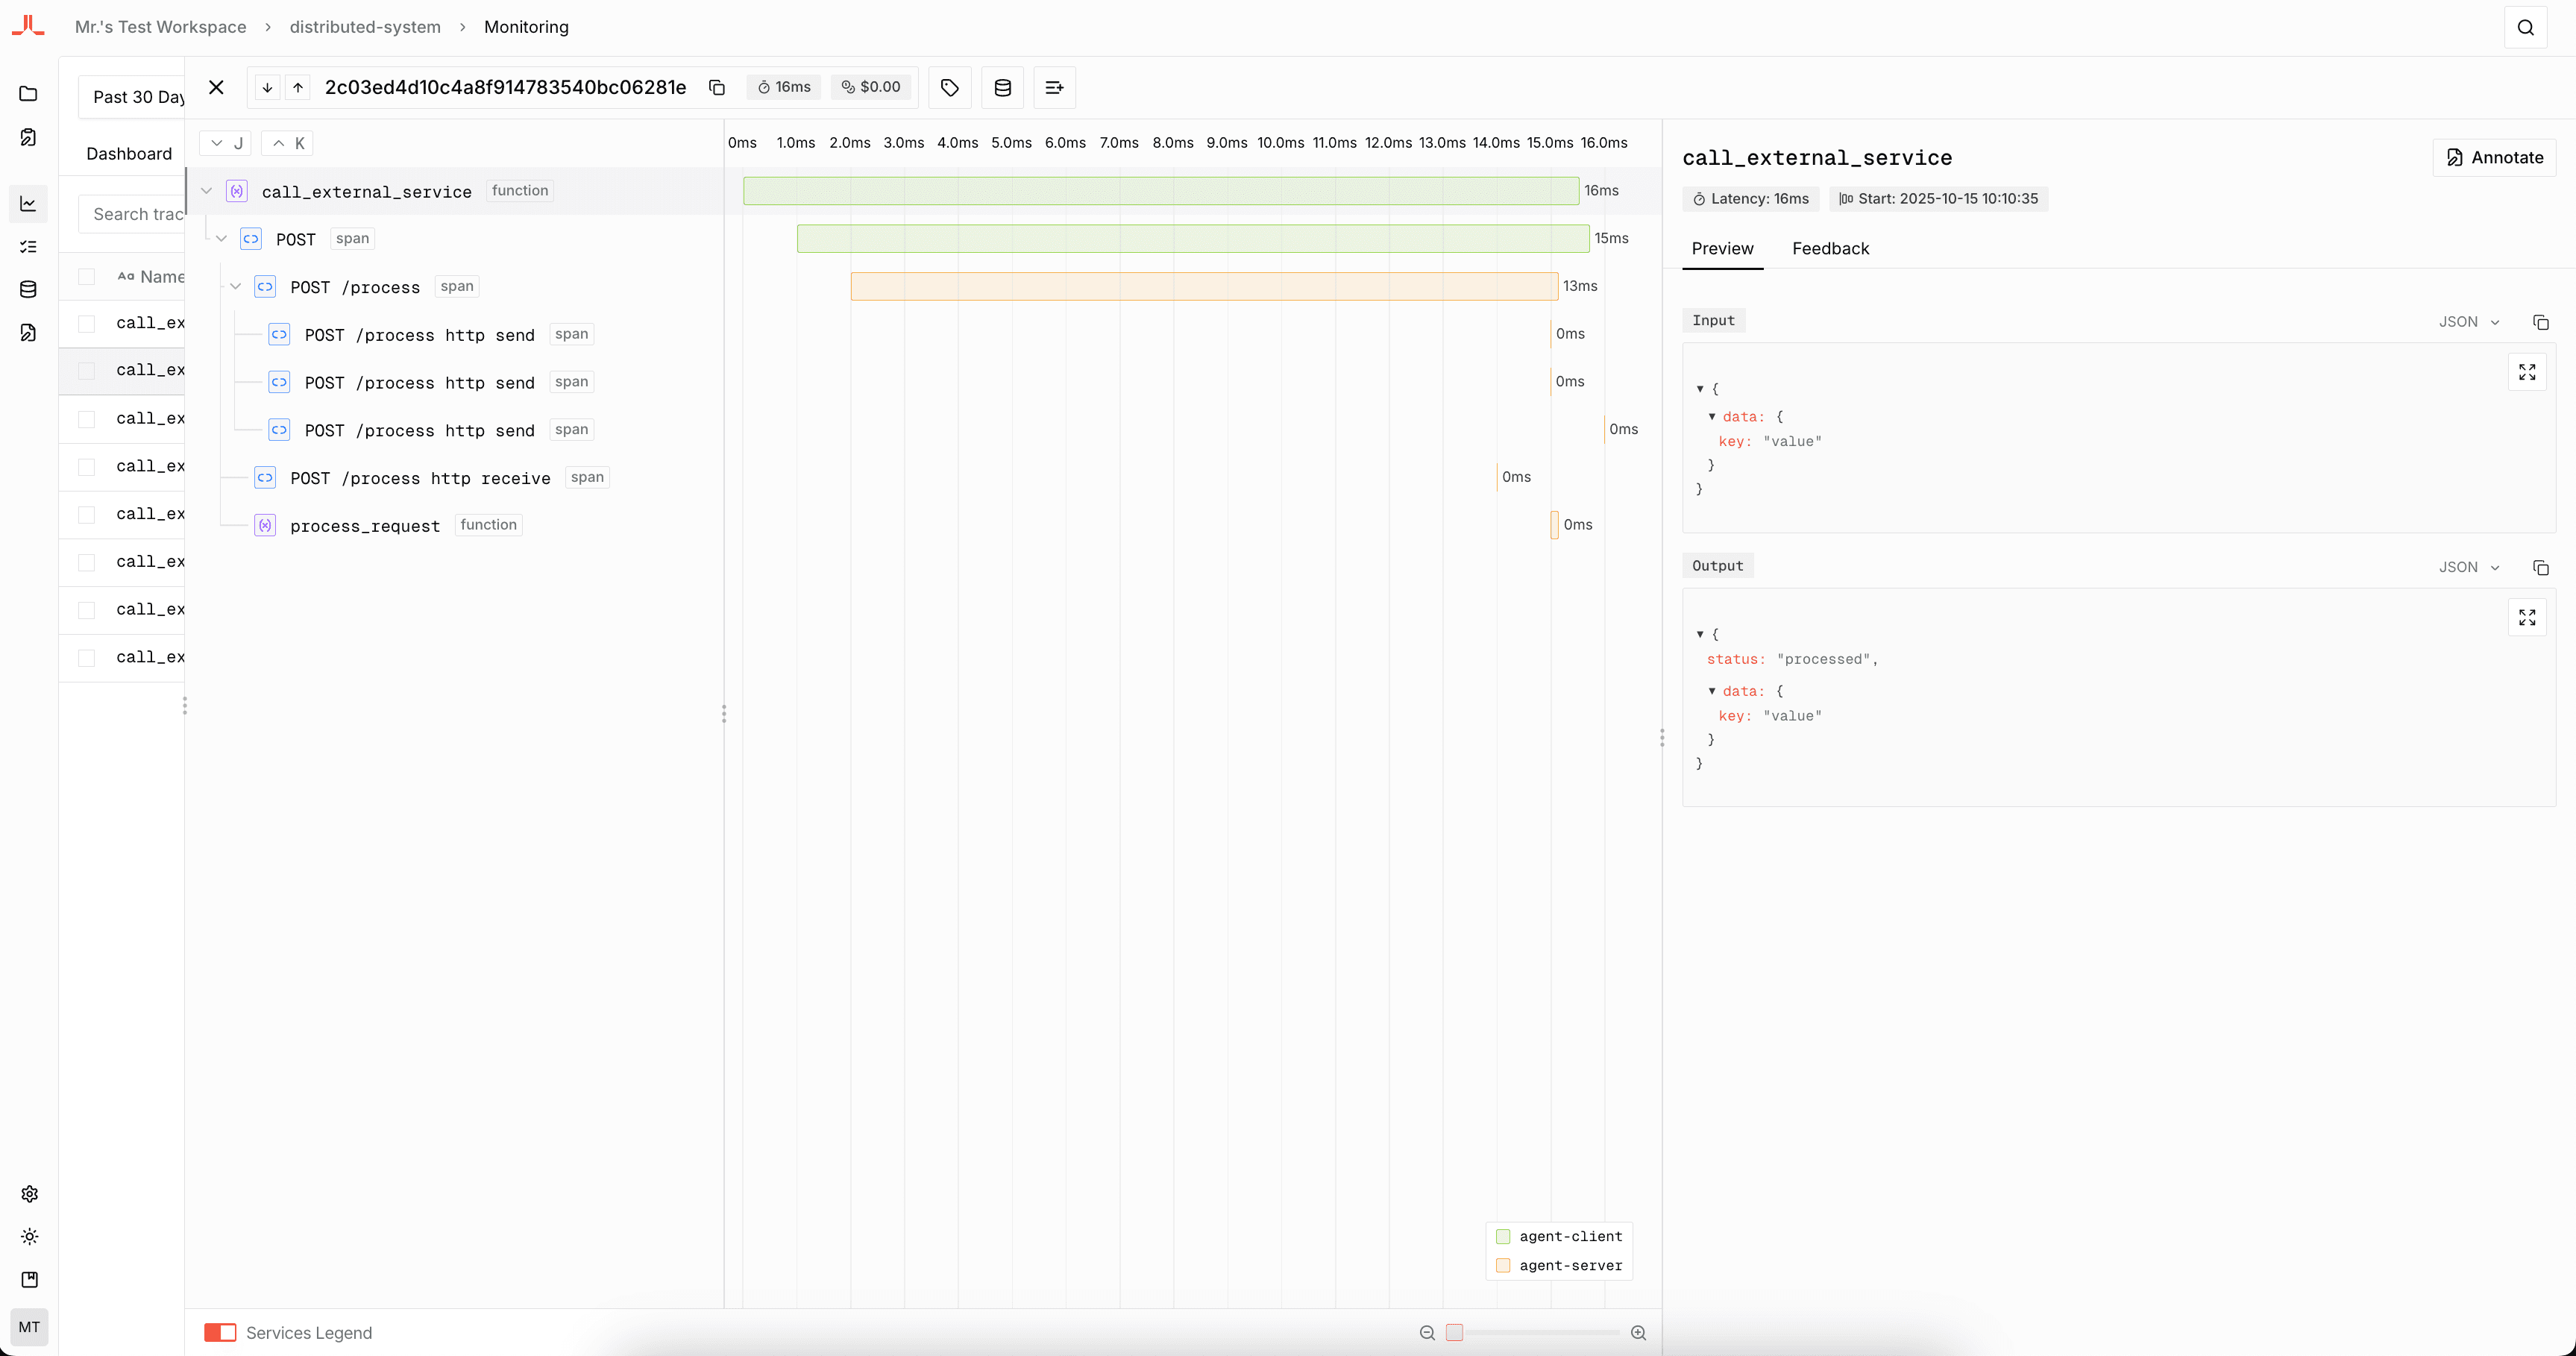
Subagent Tracing
Use a forked trace when one agent delegates a meaningful chunk of work to a subagent. The parent trace keeps a lightweight invocation span, while the subagent runs in its own linked trace with its own span tree. Only use this when evaluations are unique to the subagent, because forked subagent runs are treated as their own traces.
Add fork=True to the subagent function you want to split into a linked trace:
from judgeval import Tracer
Tracer.init(project_name="default_project")
@Tracer.observe(span_type="tool")
def retrieve_policy_context(question: str) -> str:
return f"Relevant policy excerpts for: {question}"
@Tracer.observe(span_type="agent", fork=True)
def policy_subagent(question: str) -> str:
context = retrieve_policy_context(question)
return f"Policy answer based on: {context}"
@Tracer.observe(span_type="agent")
def support_agent(question: str) -> str:
if "refund" in question.lower():
return policy_subagent(question)
return "No policy lookup needed."
if __name__ == "__main__":
print(support_agent("Can I get a refund after 45 days?"))Add fork: true to the subagent wrapper you want to split into a linked trace:
import { Tracer } from "judgeval";

await Tracer.init({
    projectName: "default_project",
});
const retrievePolicyContext = Tracer.observe(
async function retrievePolicyContext(question: string): Promise<string> {
return `Relevant policy excerpts for: ${question}`;
},
{ spanType: "tool" }
);
const policySubagent = Tracer.observe(
async function policySubagent(question: string): Promise<string> {
const context = await retrievePolicyContext(question);
return `Policy answer based on: ${context}`;
},
{ spanType: "agent", fork: true }
);
const supportAgent = Tracer.observe(
async function supportAgent(question: string): Promise<string> {
if (question.toLowerCase().includes("refund")) {
return await policySubagent(question);
}
return "No policy lookup needed.";
},
{ spanType: "agent" }
);
console.log(await supportAgent("Can I get a refund after 45 days?"));
await Tracer.shutdown();Toggling Monitoring
If your setup requires you to toggle monitoring intermittently, you can disable monitoring by:
- Setting the
JUDGMENT_MONITORINGenvironment variable tofalse(Disables tracing)
export JUDGMENT_MONITORING=false- Setting the
JUDGMENT_EVALUATIONSenvironment variable tofalse(Disables scoring on traces)
export JUDGMENT_EVALUATIONS=falseNext Steps
- Tracer SDK Reference - Explore the complete Tracer API including span access, metadata, and advanced configuration