Tracing
Anatomy of a trace
A trace is a record of a single request to an agent, made up of multiple spans.
Traces record the path of an agent's execution, making it easy to debug issues and understand the flow of an agent. Beyond debugging, traces can be in combination with evaluation metrics to form valuable reward signals for agent optimization.
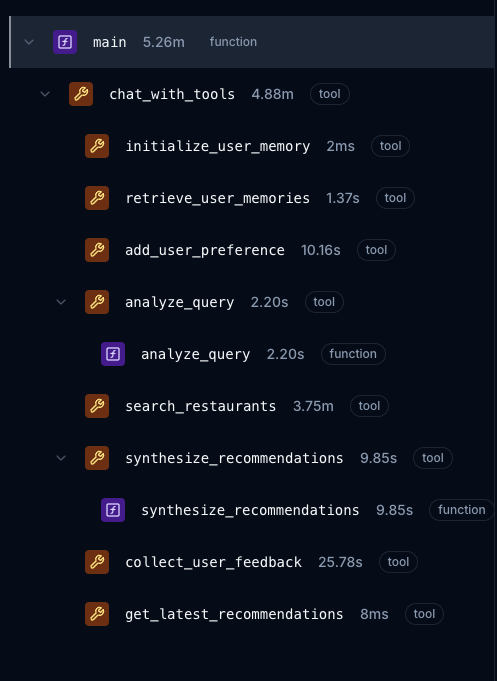 Example of tracing a travel agent creating a trip itinerary (each box is a span)
Spans
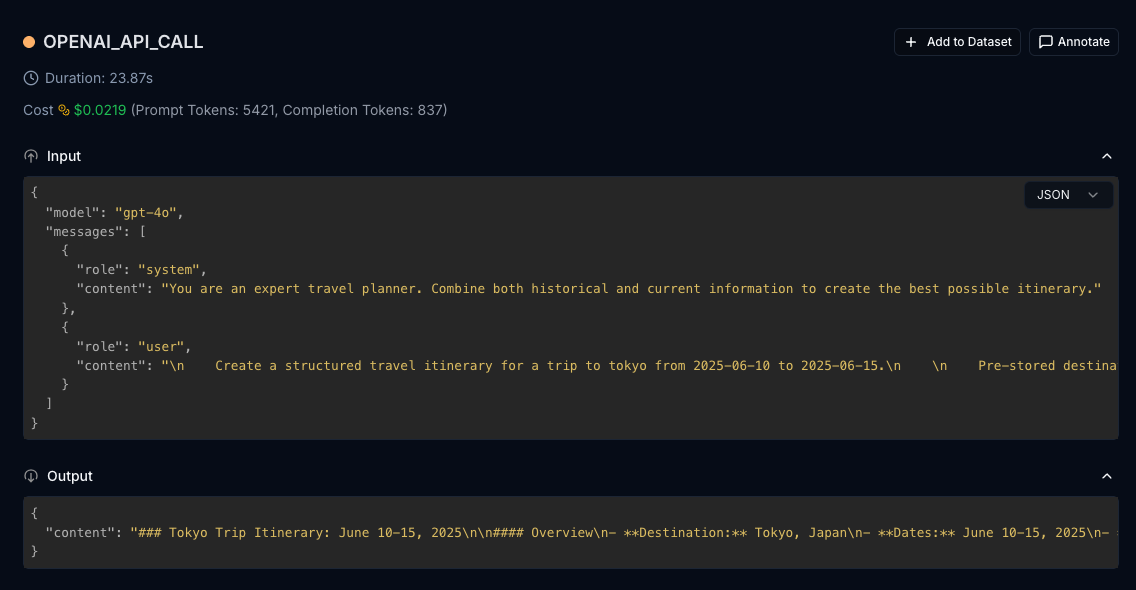
Spans are the atomic units of work in an agent trace. They have an input, output, start time, and end time. Trace spans capture operations such as tool calls, LLM calls, and reasoning steps.
Here is an example of a span of an LLM call:
Span Types
Span types are used to categorize the various types of operations recorded in a trace.
from judgeval.tracer import Tracer

judgment = Tracer(project_name="default_project")

@judgment.observe(span_type="tool")
def my_tool(...):
    pass